
Weekly Market Commentary
June 21st, 2025
Week in Review…
This past week offered a wealth of economic data, with inflation and consumer strength emerging as the dominant themes. Markets responded positively to signs of easing inflationary pressures and continued resilience in consumer demand, two key factors shaping the outlook for monetary policy and economic growth.
Inflation: Cooling but Still in Focus
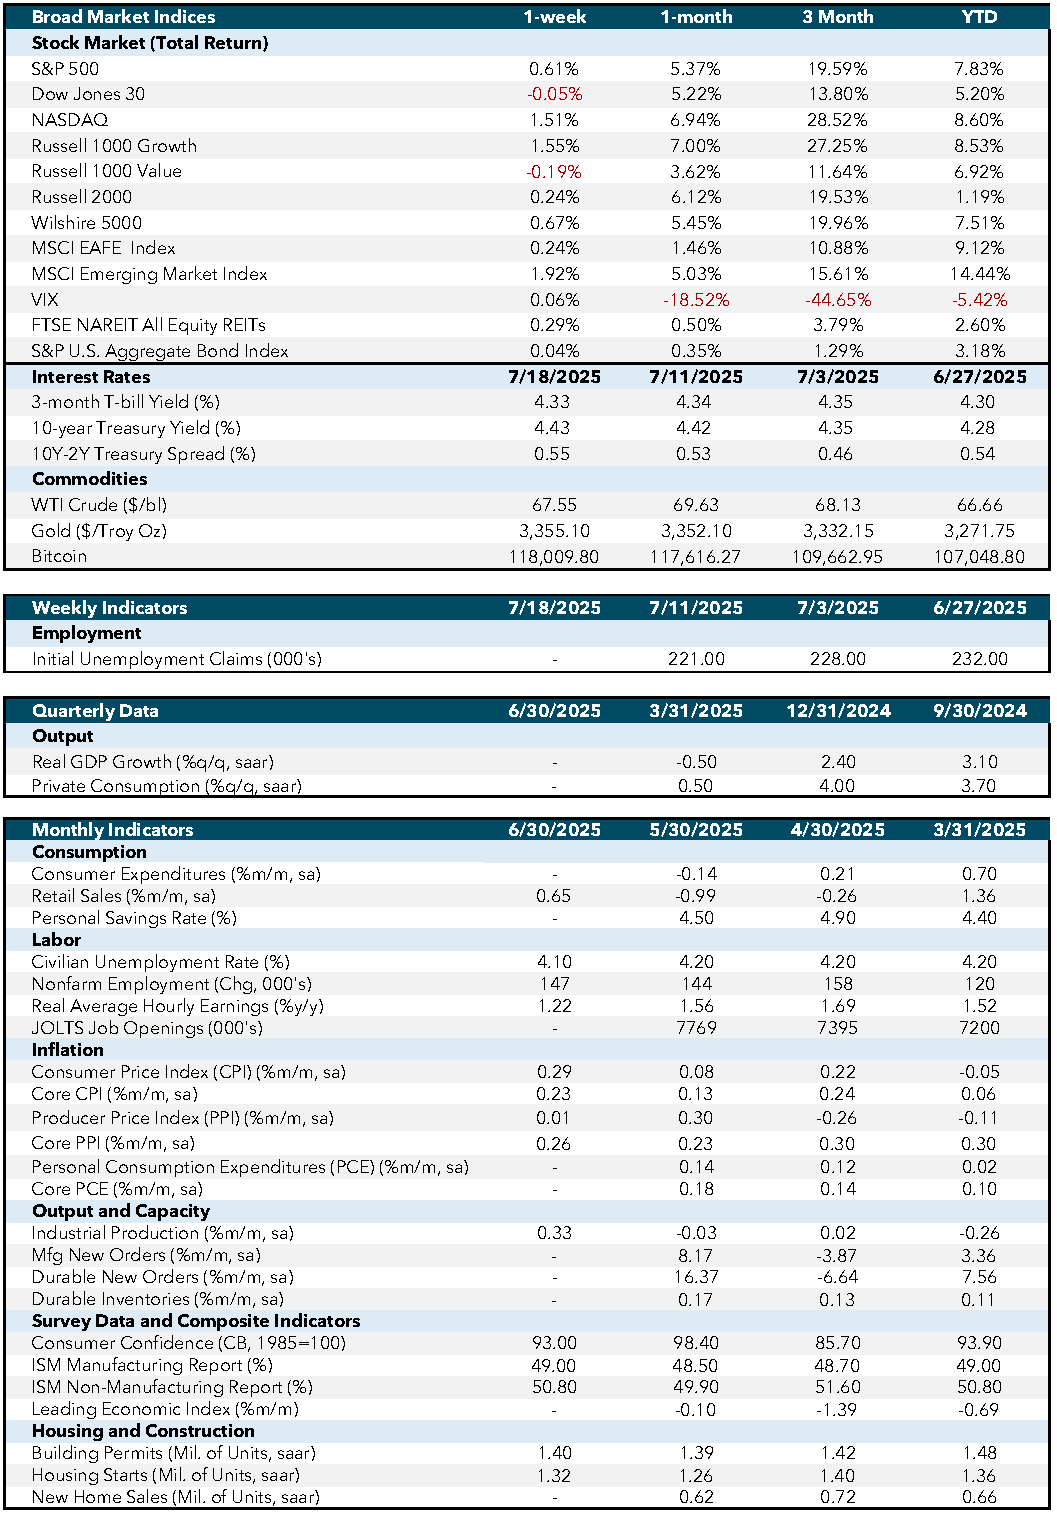
Tuesday’s Consumer Price Index (CPI) report showed core CPI rose 0.2% month-over-month, slightly below expectations and marking a fifth straight month of softer-than-expected readings. While headline CPI came in hotter, its volatility, especially from energy, makes core CPI the more reliable gauge.
On Wednesday, Producer Price Index (PPI) data reinforced the disinflation trend, with both core and headline PPI flat and below forecasts, suggesting waning cost pressures for businesses and the potential for improved profit margins. Rounding out the week, the University of Michigan’s inflation expectations for both 1-year and 5-year horizons declined, continuing the theme of lower-than-expected inflation.
Consumer Demand: Still Strong and Broad-based
Despite inflation concerns, the U.S. consumer remains resilient. Thursday’s retail sales report surprised to the upside, with headline sales rising 0.6% and core retail sales up 0.5%, a sharp rebound from last month’s decline.
Strength also showed in housing, where building permits and housing starts exceeded forecasts, suggesting homebuilders are more optimistic about future demand. Finally, consumer sentiment improved, with the University of Michigan’s survey showing gains in both expectations and overall confidence.
Economic and Capital Markets Dashboard
Week Ahead…

This week brings a flurry of economic data, with housing taking center stage.
On Wednesday, the National Association of Realtors releases existing home sales data. Markets will be watching closely for signs of continued strength following last week’s upbeat housing indicators. As a key measure of consumer demand, this report also offers insight into broader economic momentum.
Thursday brings finalized building permits and new home sales reports. Building permits, a leading indicator of future construction, will be assessed for any revisions or signs of sustained growth. New home sales, which often move in tandem with existing home sales, will provide further clarity on housing demand.
Also on Thursday, Manufacturing and Services Purchasing Managers’ Index (PMI) sentiment data will be released, offering a read on whether business and consumer confidence aligns with last week’s strong retail sales. On Friday, attention shifts to durable goods orders, a key indicator of business and consumer confidence in big-ticket spending. Core durable goods orders, which exclude transportation items, will be especially important as a proxy for business investment.
Finally, markets will get a fresh read on inflation expectations through the 10-year Treasury Inflation Protected Securities (TIPS) auction, offering a direct reflection of market-based expectations for future inflation. The 20-year bond auction will also provide insight into investor sentiment at the long end of the yield curve.
Together, these data points will help shape expectations for the Fed’s next move and the broader economic outlook.
Economic Indicators:
- CPI: Consumer Price Index measures the average change in prices paid by consumers for goods and services over time. Source: Bureau of Labor Statistics.
- Core CPI: Core Consumer Price Index excludes food and energy prices to provide a clearer picture of long-term inflation trends. Source: Bureau of Labor Statistics.
- PPI: Producer Price Index measures the average change in selling prices received by domestic producers for their output. Source: Bureau of Labor Statistics.
- Core PPI: Core Producer Price Index excludes food and energy prices to provide a clearer picture of long-term inflation trends. Source: Bureau of Labor Statistics.
- PCE: Personal Consumption Expenditures measure the average change in prices paid by consumers for goods and services. Source: Bureau of Economic Analysis.
- Core PCE: Core Personal Consumption Expenditures exclude food and energy prices to provide a clearer picture of long-term inflation trends. Source: Bureau of Economic Analysis.
- Industrial Production: Measures the output of the industrial sector, including manufacturing, mining, and utilities. Source: Federal Reserve.
- Mfg New Orders: Measures the value of new orders placed with manufacturers for durable and non-durable goods. Source: Census Bureau.
- Durable New Orders: Measures the value of new orders placed with manufacturers of durable goods. Source: Census Bureau.
- Durable Inventories: Measures the value of inventories held by manufacturers for durable goods. Source: Census Bureau.
- Consumer Confidence (CB, 1985=100): Measures the degree of optimism that consumers feel about the overall state of the economy and their personal financial situation. Source: Conference Board.
- ISM Manufacturing Report: Measures the economic health of the manufacturing sector based on surveys of purchasing managers. Source: Institute for Supply Management.
- ISM Non-Manufacturing Report: Measures the economic health of the non-manufacturing sector based on surveys of purchasing managers. Source: Institute for Supply Management.
- Leading Economic Index: Measures overall economic activity and predicts future economic trends. Source: Conference Board.
- Building Permits (Mil. of Units, saar): Measures the number of new residential building permits issued. Source: Census Bureau.
- Housing Starts (Mil. of Units, saar): Measures the number of new residential construction projects that have begun. Source: Census Bureau.
- New Home Sales (Mil. of Units, saar): Measures the number of newly constructed homes sold. Source: Census Bureau.
- SA: Seasonally adjusted.
- SAAR: Seasonally adjusted annual rate.
Market Indices & Indicators:
- S&P 500: A market-capitalization-weighted index of 500 leading publicly traded companies in the U.S., widely regarded as one of the best gauges of large U.S. stocks and the stock market overall.
- Dow Jones 30: Also known as the Dow Jones Industrial Average, it tracks the share price performance of 30 large, publicly traded U.S. companies, serving as a barometer of the stock market and economy.
- NASDAQ: The world’s first electronic stock exchange, primarily listing technology giants and operating 29 markets globally.
- Russell 1000 Growth: Measures the performance of large-cap growth segment of the U.S. equity universe, including companies with higher price-to-book ratios and growth metrics.
- Russell 1000 Value: Measures the performance of large-cap value segment of the U.S. equity universe, including companies with lower price-to-book ratios and growth metrics.
- Russell 2000: A market index composed of 2,000 small-cap companies, widely used as a benchmark for small-cap mutual funds.
- Wilshire 5000: A market-capitalization-weighted index capturing the performance of all American stocks actively traded in the U.S., representing the broadest measure of the U.S. stock market.
- MSCI EAFE Index: An equity index capturing large and mid-cap representation across developed markets countries around the world, excluding the U.S. and Canada.
- MSCI Emerging Market Index: Captures large and mid-cap representation across emerging markets countries, covering approximately 85% of the free float-adjusted market capitalization in each country.
- VIX: The CBOE Volatility Index measures the market’s expectations for volatility over the coming 30 days, often referred to as the “fear gauge.”
- FTSE NAREIT All Equity REITs: Measures the performance of all publicly traded equity real estate investment trusts (REITs) listed in the U.S., excluding mortgage REITs.
- S&P U.S. Aggregate Bond Index: Represents the performance of the U.S. investment-grade bond market, including government, corporate, mortgage-backed, and asset-backed securities.
- 3-Month T-bill Yield (%): The yield on U.S. Treasury bills with a maturity of three months, reflecting short-term interest rates.
- 10-Year Treasury Yield (%): The yield on U.S. Treasury bonds with a maturity of ten years, reflecting long-term interest rates.
- 10Y-2Y Treasury Spread (%): The difference between the yields on 10-year and 2-year U.S. Treasury bonds, often used as an indicator of economic expectations.
- WTI Crude ($/bl): The price per barrel of West Texas Intermediate crude oil, a benchmark for U.S. oil prices.
- Gold ($/Troy Oz): The price per troy ounce of gold, a standard measure for gold prices.
- Bitcoin: A decentralized digital currency without a central bank or single administrator, which can be sent from user to user on the peer-to-peer bitcoin network.
This content was developed by Cambridge from sources believed to be reliable. This content is provided for informational purposes only and should not be construed or acted upon as individualized investment advice. It should not be considered a recommendation or solicitation. Information is subject to change. Any forward-looking statements are based on assumptions, may not materialize, and are subject to revision without notice. The information in this material is not intended as tax or legal advice.
Investing involves risk. Depending on the different types of investments there may be varying degrees of risk. Socially responsible investing does not guarantee any amount of success. Clients and prospective clients should be prepared to bear investment loss including loss of original principal. Indices mentioned are unmanaged and cannot be invested into directly. Past performance is not a guarantee of future results.
The Dow Jones Industrial Average (DJIA) is a price-weighted index composed of 30 widely traded blue-chip U.S. common stocks. The S&P 500 is a market-cap weighted index composed of the common stocks of 500 leading companies in leading industries of the U.S. economy. The NASDAQ Composite Index is a market-value weighted index of all common stocks listed on the NASDAQ stock exchange.